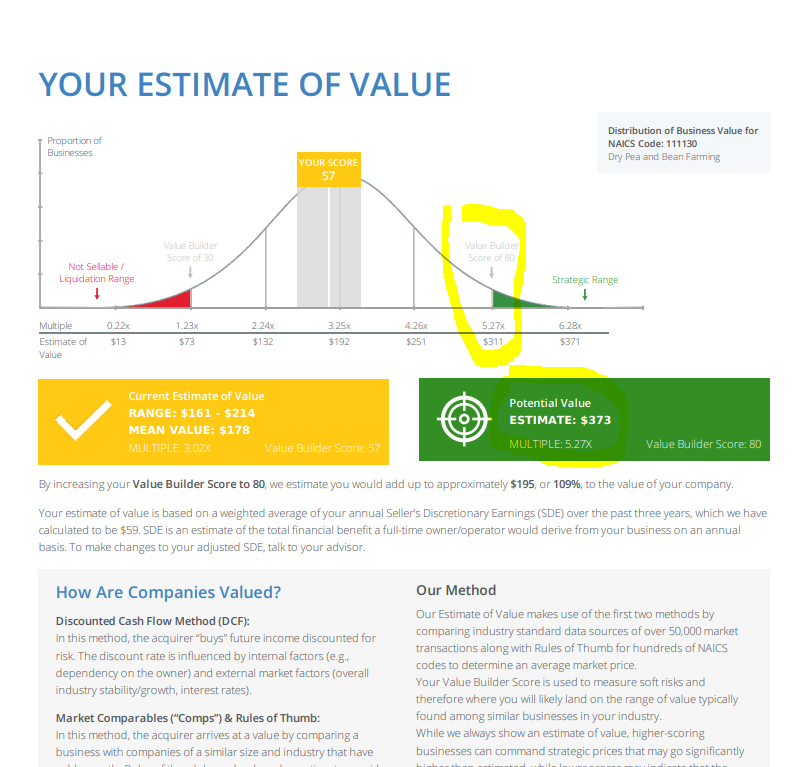
Our Potential Value underneath the graph view on Page 4 in the report (green box) is the best possible value you could receive by achieving a Value Builder Score of 80+. This value is the "Strategic range" point that you see in the graph.
The graph shows the mean value for each score, however, the Estimate of Value for the company is a range of low and high with the mean being the likely value you can expect to receive. This is why we provide a range for the "Current Estimate of Value".
The Potential Value illustrates the maximum value you can expect to receive from increasing your Value Builder Score to 80+. The graph itself displays the mean value you can expect with a score of 80 (however a range is not shown in this case).